Loading blog post...

Uber Technologies, Inc., founded in 2009, revolutionized urban transportation by creating a platform that connects riders with drivers through a mobile app. What began as a simple idea to hail a black car in San Francisco has evolved into a global mobility giant, operating in over 10,000 cities across 70 countries. Uber's success lies in its seamless integration of technology, data-driven decision-making, and a scalable business model.
Uber started with a monolithic architecture - a single backend service, frontend, and database. But quickly outgrew it due to rapid scaling
By 2016, Uber transitioned to a microservices-based architecture to handle millions of daily trips, incorporating tools like Node.js, React.js, Apache Kafka for real-time data streaming, and databases such as MySQL, Cassandra, and Riak for high availability. This shift enabled domain-oriented microservices, allowing independent teams to manage specific functions like trip management, payments, and routing. Uber's platform now processes billions of data points daily, leveraging machine learning (ML) for predictions like estimated time of arrival (ETA) and dynamic pricing. Key challenges included handling real-time data from GPS, traffic, and user interactions while maintaining reliability and speed.
How Uber Works: User and Driver Flows
Uber operates through two primary apps: one for riders and one for drivers, connected via a backend dispatch system.
Rider Flow
Request a Ride: The rider enters pickup and destination via the app. The system queries nearby drivers using geospatial indexing (e.g., geohashing or quadtrees).
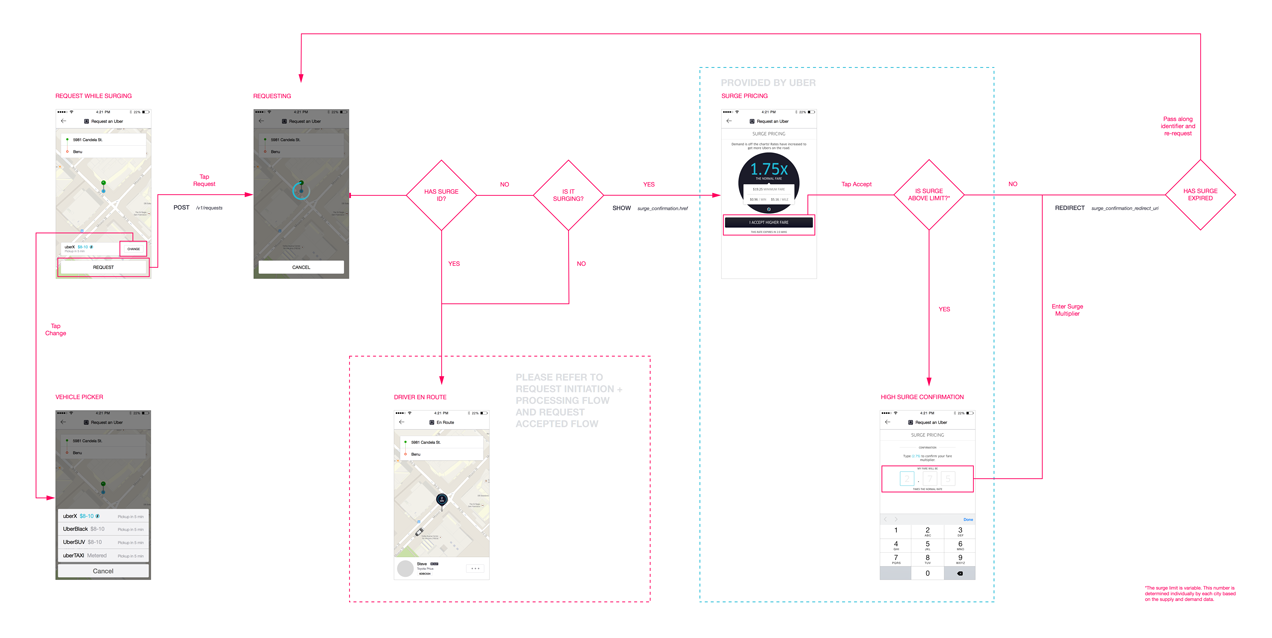
Fare Estimate: Before confirming, the app displays an upfront fare based on distance, time, and surge multipliers.
Matching and Confirmation: Once confirmed, the dispatch system matches the rider to a driver (detailed later). The rider sees real-time ETA and tracking.
Trip Completion: After the ride, payment is processed automatically, and ratings are exchanged.
Driver Flow
Go Online: Drivers log in and share their location every few seconds via WebSockets for real-time updates.
Receive Requests: The app pushes ride requests; drivers accept or reject.
Navigation and Completion: During the trip, turn-by-turn navigation is provided. Post-trip, earnings are updated.
The workflow ensures minimal wait times, with DISCO optimizing matches to reduce extra driving and ETA.
Connecting Users and Drivers (Matching Algorithm)
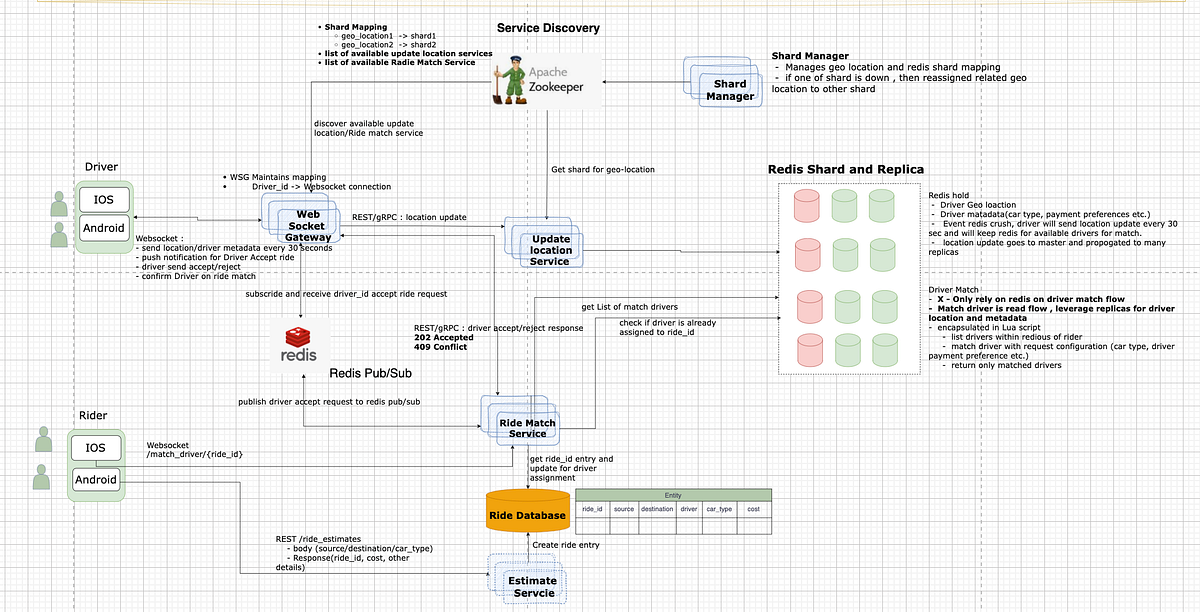
Matching is handled by DISCO, processing over 30 million predictions per minute. Steps include:
Location Updates: Drivers send GPS every 30 seconds; riders request via app.
Candidate Selection: Using sharding (e.g., Redis shards for geo-locations), find nearby drivers.
Scoring and Optimization: ML ranks candidates by ETA, ratings, vehicle type, and preferences. Goals: Minimize wait time and extra driving.
Assignment: Push notification to the best driver; if rejected, re-match quickly.
Advanced Features: Batch matching for pooled rides, safety checks via ML.
The system uses WebSockets for bidirectional communication and Redis Pub/Sub for event handling.
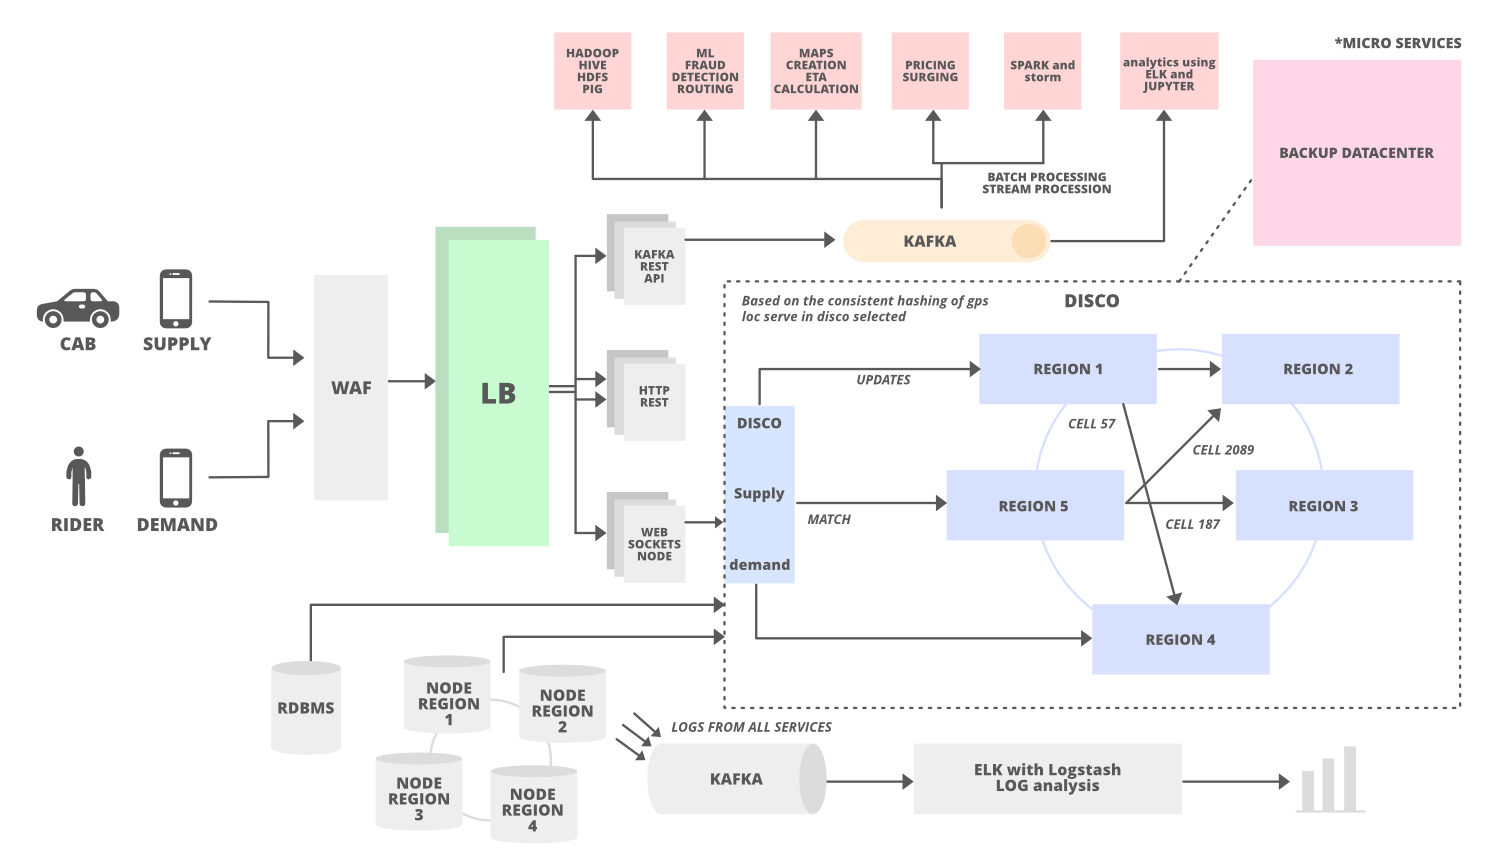
Uber's architecture is a distributed system designed for scalability and fault tolerance. It uses a service-oriented architecture (SOA) with microservices communicating via APIs, supported by tools like HAProxy for load balancing and Hyperbahn for service discovery. The system divides the world into geographic cells using Google's S2 library for efficient location-based queries. The core includes:
Frontend Apps: Built for iOS and Android using frameworks like React Native for cross-platform compatibility. The rider app follows patterns like Riblets (inspired by VIPER), where business logic drives routing rather than views.
Backend Services: Microservices handle functions such as user authentication, trip dispatching (via DISCO—Dispatch Optimization), and payments. Kafka streams real-time events, while Hadoop processes batch analytics.
Databases: Relational (RDBMS like MySQL) for structured data, NoSQL (Cassandra, Riak) for high-availability reads/writes, and Schemaless (built on MySQL) for long-term storage.
Data Processing: Apache Flink and Spark for real-time and batch processing, integrated with ML platforms like Michelangelo for features like fraud detection and ETA calculation.
Uber integrates third-party services like Google Maps API and Waze for routing, traffic data, and navigation. Optimization involves:
Route Calculation: Using algorithms like Dijkstra's or A* to find the fastest paths, factoring in real-time traffic, weather, and roadblocks.
AI-Driven ETAs: ML models in Michelangelo recalculate ETAs continuously, processing GPS updates, historical data, and external factors.
Proactive Routing: Unlike static maps, Uber's system uses dynamic, real-time data streams to adjust routes on-the-fly, minimizing detours.
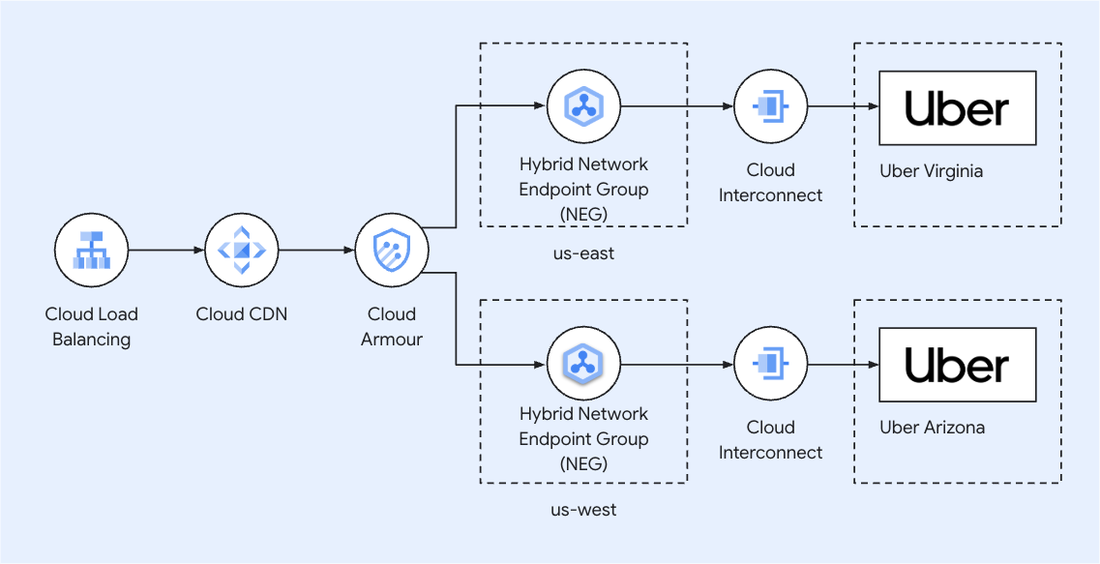
This integration is abstracted in the backend, with Uber's maps teams focusing on data accuracy and tooling. For low latency, Uber employs edge computing and Hybrid Network Endpoint Groups (NEGs) with Google Cloud for efficient data routing.
Uber prioritizes low-latency operations (<1 minute for matching) to ensure a smooth experience. Key mechanisms include:
Real-Time Streaming: Kafka and Pub/Sub messaging broadcast location updates in milliseconds.
Geospatial Indexing: S2 library divides maps into cells (e.g., 3km²), enabling fast queries without scanning entire databases.
Caching and GPUs: Features like ETA use GPU-accelerated DL models in Michelangelo 2.0 for sub-second inferences.
Distributed Processing: Apache Flink handles real-time data ingestion from GPS, reducing delays in traffic monitoring.
Edge Gateways: API gateways route requests efficiently, minimizing hops.
These ensure "no latency" perception, though actual processing is near-real-time.
Fare Calculation
Fares are calculated dynamically using the Pricing Engine. The formula typically includes:
Base Fare: Fixed starting fee.
Distance Fare: Per mile/km charge.
Time Fare: Per minute charge, especially in traffic.
Surge Multiplier: AI-driven adjustment based on supply/demand, processing inputs like request volume, driver availability, weather, and events.
Additional Fees: Tolls, service fees, promotions/discounts.
Post-Trip Adjustments: If the route deviates, fares may be recalculated.
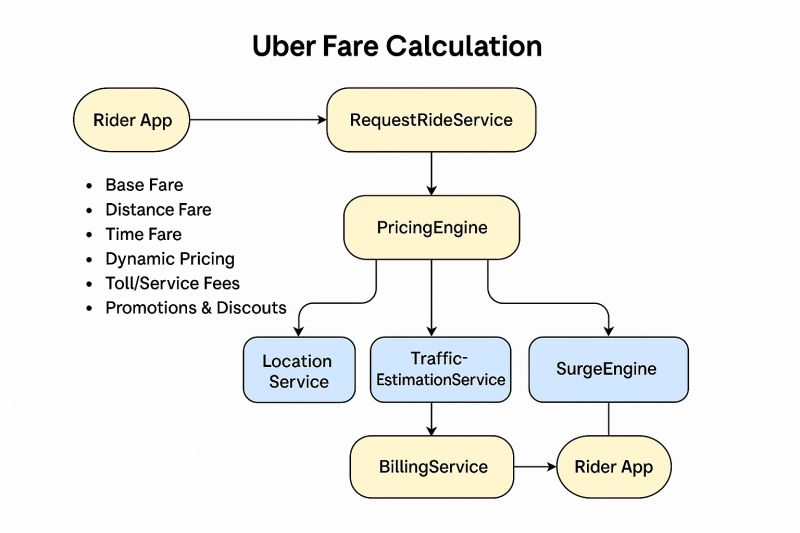
The Surge Engine monitors regions via GeoHash grids, applying multipliers in real-time. Billing Service handles payments post-trip.
Revenue Model
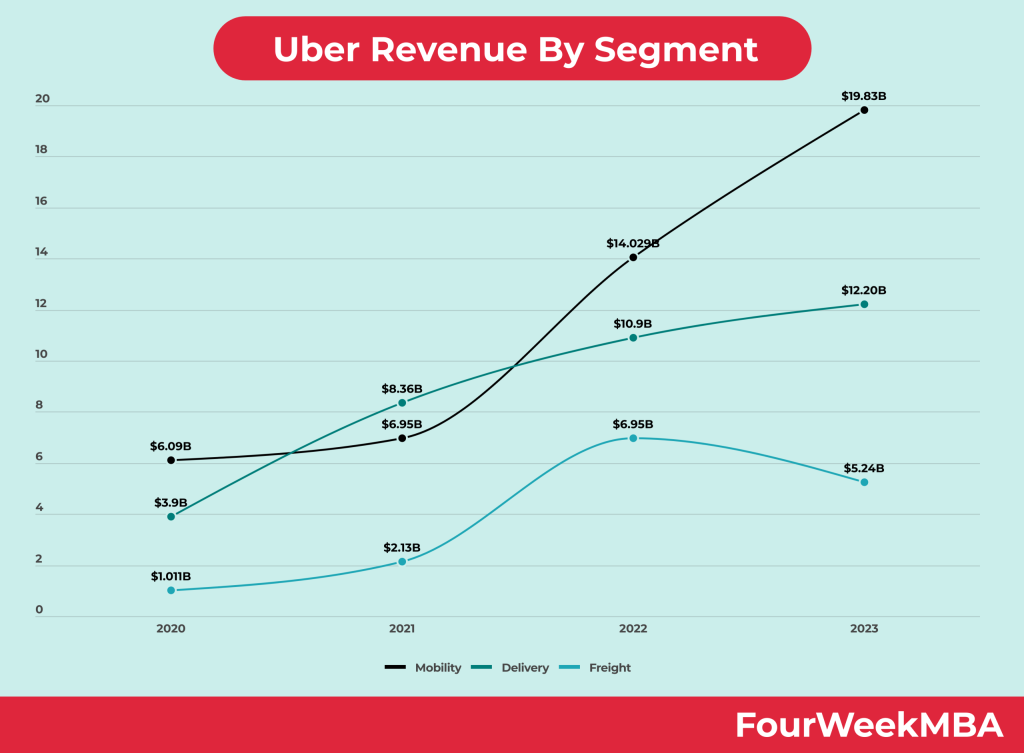
Uber generates revenue primarily through commissions (take rates) on gross bookings, diversified across segments:
Mobility (Rides): 29% take rate on $40B+ bookings (2023), from driver commissions.
Delivery (Uber Eats): 18% take rate, including fees from restaurants and couriers.
Freight: Logistics services with lower margins (1%).
Other Sources: Advertising, subscriptions (Uber One), and partnerships.
In 2023, total revenue reached $37.28B, with Mobility at $19.83B, Delivery at $12.20B, and Freight at $5.24B. Operating profit hit $1.08B in Q2 2024, driven by scale and efficiency. The model relies on network effects: more users attract more drivers, reducing costs.
Uber's transformation from a startup to a tech powerhouse showcases the power of microservices, real-time data processing, and AI in disrupting transportation. By optimizing integrations like Google Maps, ensuring low latency through advanced indexing and streaming, and employing sophisticated algorithms for fares and matching, Uber delivers reliable service at scale. Its revenue model, fueled by diversification, positions it for continued growth. Future challenges include regulatory hurdles and autonomous vehicles, but Uber's architecture provides a great foundation.